Image Details
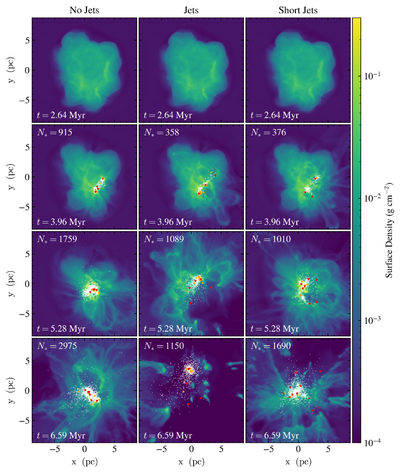
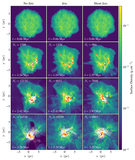
Caption: Figure 3.
Projection plots of density along the z-axis are shown for the S-nojet1, S-jet1, and S-short runs at four points in time. The projected x-y position of each star particle is shown as a white dot for nonfeedback stars and an orange star for any star that is currently injecting either winds or jets. Sink particles are shown as red Y symbols. The time for each plot and the number of star particles are shown on each panel. For these runs, tff = 2.2 Myr, so the plotted times correspond to approximately 1.2 tff, 1.8 tff, 2.4 tff, and 3.0 tff since the start of the run. Movies of the projected density for each of the runs presented in this paper can be found, along with the Globus Collection for the data in this paper, at DOI: 10.5531/sd.astro.10 (S. M. Appel et al. 2025).
Other Images in This Article

Show More
Copyright and Terms & Conditions
© 2026. The Author(s). Published by the American Astronomical Society.