Image Details
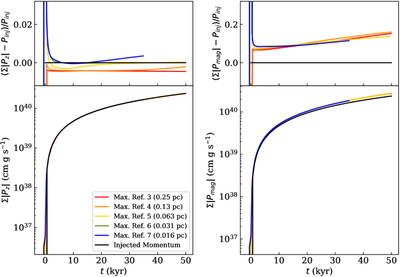
Caption: Figure 11.
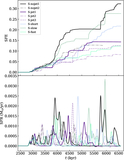
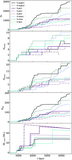
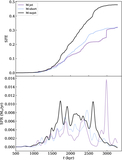
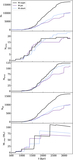
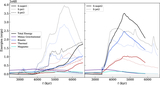
A comparison of the analytic expectation of the total injected momentum (black line; based on the default jet parameters and a 5 M⊙ star particle) to the actual total z-direction momentum of the gas (left column) and the total momentum magnitude of the gas (right column) as functions of time since a single jet began to be injected. The lower panels show the momentum values, while the upper panels show the percent differences relative to the expected total injected momentum. Runs with five different maximum refinement levels are shown and the corresponding minimum cell size is listed in the legend.
Other Images in This Article
Show More
Copyright and Terms & Conditions
© 2026. The Author(s). Published by the American Astronomical Society.