Image Details
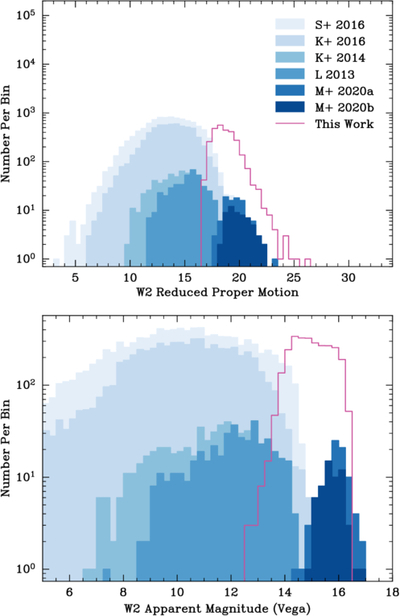
Caption: Figure 8.
Histograms comparing the number of fast (﹩\mu \geqslant 0\mathop{.}\limits^{^{\prime\prime} }35\,{\mathrm{yr}}^{-1}﹩) objects detected by SMDET (magenta line) and other WISE searches (blue areas). W2 reduced proper motion (top) and W2 apparent magnitude (bottom) are on the x-axes, with the number of objects per bin on the y-axes. All series are overplotted—not stacked. K = J. D. Kirkpatrick et al. (2014, 2016), S = A. C. Schneider et al. (2016), L = K. L. Luhman (2014), M = A. M. Meisner et al. (2020a, 2020b).
Other Images in This Article
Copyright and Terms & Conditions
© 2026. The Author(s). Published by the American Astronomical Society.
Copyright ©
2026 Astronomy Image Explorer. All Rights Reserved.