Image Details
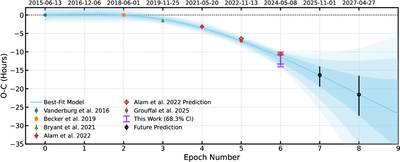
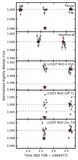
Caption: Figure 7.
Observed minus calculated (O − C) transit times as a function of epoch number for HIP 41378 f. Solid symbols denote previously published transits from K2 and NGTS analyses (A. Vanderburg et al. 2016; J. C. Becker et al. 2019; E. M. Bryant et al. 2021), as well as HST observations from A22, with associated error bars (smaller than the symbol size). The dotted black line represents a linear ephemeris using the period from A. Santerne et al. (2019) and the reference transit time from A. Vanderburg et al. (2016). The solid blue curve shows our best-fit TTV model, with shaded bands indicating the 68.3%, 95.4%, and 99.7% posterior predictive intervals. At epoch 6, our updated transit time is shown as a set of vertical purple error bars, with darker shades corresponding to the 68%/95%/99% credible intervals in Figure 5. Open black circles at epochs 7 and 8 mark our predicted future transits, with statistical uncertainties shown as thick black error bars. The upper x-axis shows the corresponding UTC calendar dates.
Other Images in This Article
Copyright and Terms & Conditions
© 2026. The Author(s). Published by the American Astronomical Society.