Image Details
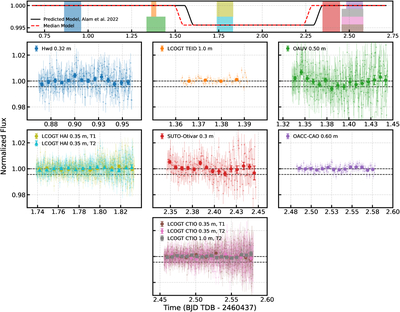
Caption: Figure 3.
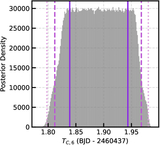
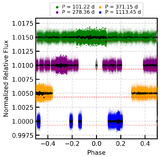
Top panel: Temporal coverage overview for all single-night observations during the 2024 May 7–9 campaign. Colored rectangles indicate the observation window for each telescope, vertically offset to show overlapping observations. The black solid line shows the predicted transit model from A22, and the red dashed line shows our fitted median model (Section 5.1). Bottom panels: Photometry from each single-night facility in the campaign, shown chronologically from top-left to bottom-center. Although these datasets span only a single night such that we cannot not use them in the light curve fit, the flatness of each time series provides visual confirmation that no transit ingress or egress is present. All datasets are median-normalized and detrended against airmass. We show unbinned fluxes (small, semi-transparent points) and 10 minutes binned fluxes (large symbols), color-coded by telescope: Hwd (blue circles), LCOGT TEID (orange circles), OAUV (green circles), SUTO (red circles), OACC-CAO (purple circles), LCOGT CTIO 0.35 m T1 (brown circles), LCOGT CTIO 0.35 m T2 (pink diamonds), LCOGT CTIO 1.0 m T2 (gray squares), LCOGT HAl 0.35 m T1 (light blue circles), and LCOGT HAl 0.35 m T2 (yellow triangles). The dashed black lines indicate the normalization baseline (unity) and the expected transit depth of HIP 41378 f. The flux dip observed in the OAUV data is significantly shorter than the expected transit duration.
Other Images in This Article
Copyright and Terms & Conditions
© 2026. The Author(s). Published by the American Astronomical Society.