Image Details
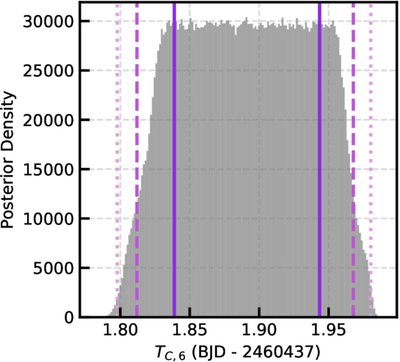
Caption: Figure 5.
The posterior density distribution of TC,6 obtained from the MCMC simulation. Vertical lines indicate the limits of the 68.27% (solid, dark purple), 95.45% (dashed, medium purple), and 99.73% (dotted, light purple) credibility intervals. The posterior is a uniform distribution since we did not catch HIP 41378 f during ingress or egress.
Other Images in This Article
Copyright and Terms & Conditions
© 2026. The Author(s). Published by the American Astronomical Society.
Copyright ©
2026 Astronomy Image Explorer. All Rights Reserved.