Image Details
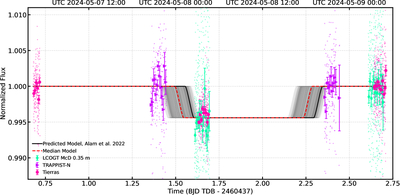
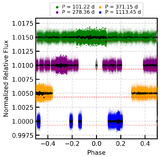
Caption: Figure 2.
The light curve for the transit of HIP 41378 f. The plot shows unbinned photometry (small, semi-transparent points) and 10 minutes binned photometry (large symbols) from multi-night datasets. The data are color-coded by telescope: Tierras (pink circles), TRAPPIST-North (violet flags), and LCOGT McD 0.35 m (teal diamonds). The predicted transit model from A22 (TC,6 = 2460438.95 ± 0.02 BJD) is shown as a solid black line. Our median model is shown as a dashed red line (TC,6 = 2460438.891 ± 0.052). Gray lines represent 500 random model iterations drawn from the posterior density distribution shown in Figure 5. All model iterations assume P = 542.07975 days, RP/R⋆ = 0.0663, a/R⋆ = 231.417, i = 89﹩\mathop{.}\limits^{\unicode{x000b0}}﹩971, and u = 0.0 (A. Santerne et al. 2019). UTC dates corresponding to the observations are displayed at the top of the figure. The LCOGT McD 1.0 m datasets are not shown; see Section 4.2 and Figure 4 for exclusion criteria.
Other Images in This Article
Copyright and Terms & Conditions
© 2026. The Author(s). Published by the American Astronomical Society.