Image Details
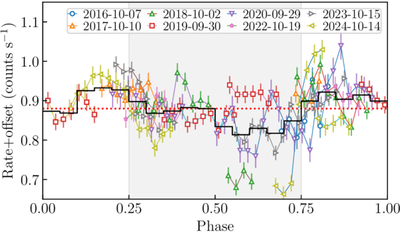
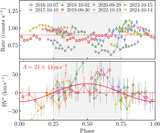
Caption: Figure 6.
Phase-folded rates shifted by offsets, showing stronger cRM signal. The offsets, with values of [−0.143, −0.052, −0.051, 0.026, −0.048, −0.099, 0.156, −0.079] for each visit as in the legend, are derived by iteratively comparing the curve of that visit to others. The red dotted line depicts the fitted median flux of 0.88 counts s−1. The black step line depicts the average binned curve showing roughly a cRM amplitude of 5.4% ± 2.5% (∼0.05 counts s−1), derived by comparing the average values of points within phases 0.10–0.25 and 0.55–0.70.
Other Images in This Article
Copyright and Terms & Conditions
© 2026. The Author(s). Published by the American Astronomical Society.
Copyright ©
2026 Astronomy Image Explorer. All Rights Reserved.