Image Details
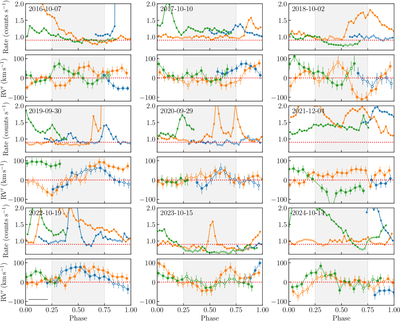
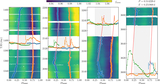
Caption: Figure 3.
Phase-folded SXR rates and ﹩{\rm{RV}}^{\prime} ﹩ curves of all observations. In each panel representing an observation, the horizontal red dotted line qualitatively indicates the quiescent level and zero ﹩{\rm{RV}}^{\prime} ﹩, while the open circles represent the points utilized in deriving the ﹩{\rm{RV}}^{\prime} ﹩ curve in Figure 4. The consecutive rotations are colored as blue, orange, and green, in turn. The red dotted lines in the rate panels depict eye-decided references of flux as 0.9 counts s−1. The horizontal bar in the bottom left panel denotes the integral time of 8000 s of spectra in the sliding mode.
Other Images in This Article
Copyright and Terms & Conditions
© 2026. The Author(s). Published by the American Astronomical Society.