Image Details
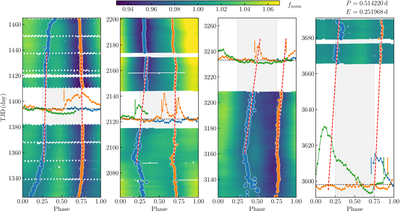
Caption: Figure 5.
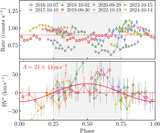
Phase-folded optical TESS (time-brightness maps) and SXR XMM-Newton RGS LCs (colored curves), overlaid by the modeled spots. Blue and orange dots represent the high- and low-latitude spots, respectively. Red dashed lines represent the linear predictions of spot locations. The SXR LCs are colored as blue, orange and green in consecutive rotations, their epochs are indicated by horizontal black dotted lines. The vertical bars, in colors as the curves, represent the onsets of flares.
Other Images in This Article
Copyright and Terms & Conditions
© 2026. The Author(s). Published by the American Astronomical Society.
Copyright ©
2026 Astronomy Image Explorer. All Rights Reserved.