Image Details
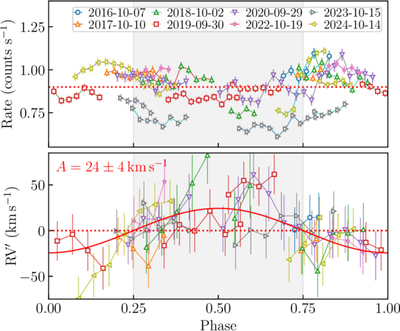
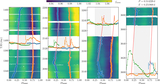
Caption: Figure 4.
Phase-folded rates and ﹩{\rm{RV}}^{\prime} ﹩s of the “background”. The ﹩{\rm{RV}}^{\prime} ﹩s are fitted by a sine curve (red line) with the amplitude A, using SCIPY.OPTIMIZE.CURVE_FIT.
Other Images in This Article
Copyright and Terms & Conditions
© 2026. The Author(s). Published by the American Astronomical Society.
Copyright ©
2026 Astronomy Image Explorer. All Rights Reserved.