Image Details
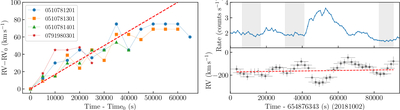
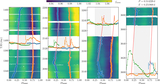
Caption: Figure 2.
Trends in measured RVs of Capella (left) and AB Dor (right). Left panel: the curves are plotted w.r.t. the onset of observations labeled by the ObsIDs (annually observed from 2013 to 2016). The red dashed line represents the unphysical trend. Right panel: the example of 2018 October 2. The red dashed line represents the linear trend (to be removed) fitting over the man-picked quiescent segments (vertical spans).
Other Images in This Article
Copyright and Terms & Conditions
© 2026. The Author(s). Published by the American Astronomical Society.
Copyright ©
2026 Astronomy Image Explorer. All Rights Reserved.