Image Details
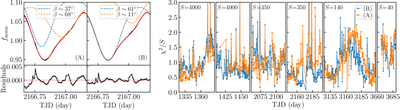
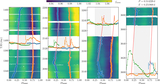
Caption: Figure 1.
Comparison between modeled spot configurations (A) and (B): An example (left) and the χ2 (right). The LCs are depicted as black solid-dot curves. The modeled curve of each spot is represented by a dashed curve (labeled by the latitude β), and their combination by a red solid curve. The χ2 is scaled by the eye-decided factor S for a better view.
Other Images in This Article
Copyright and Terms & Conditions
© 2026. The Author(s). Published by the American Astronomical Society.
Copyright ©
2026 Astronomy Image Explorer. All Rights Reserved.