Image Details
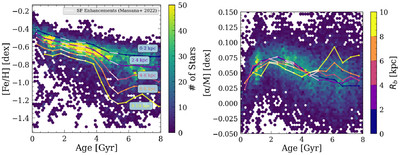
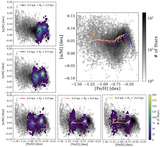
Caption: Figure 9.
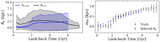
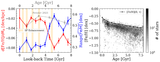
The age–metallicity (left) and the age–[α/M] relations are plotted as density in the background, and the colored lines show the median temporal evolution in each mono-Rb population. The points on each line are separated equally in age with a difference of 0.5 Gyr. These tracks place additional constraints on the gas accretion and SFH at various locations and times. For example, combining with the SF region shown in Figure 7, at 5 Gyr, the LMC accreted a large amount of pristine gas at all radii (drop in [Fe/H] in all radii in the left panel) that increased the SFE in the inner disk (from Figure 7). This led to a decrease in [α/M] in the outer disk since there was no SF and an increase of [α/M] in the inner disk where most stars were formed, contributing to the α element reservoir via SN II.
Other Images in This Article
Copyright and Terms & Conditions
© 2026. The Author(s). Published by the American Astronomical Society.