Image Details
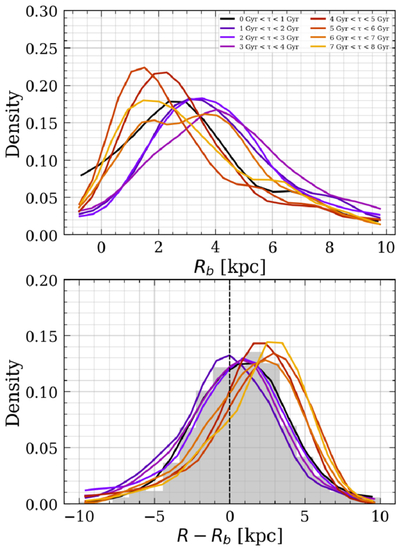
Caption: Figure 6.
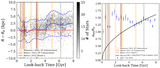
Normalized histograms showing the distribution of birth radii (top) and the amount of migration (bottom) for stars of different ages (as indicated in the legend). For each histogram, we selected the number of bins to be the integer part of ﹩\sqrt{N}/2﹩, where N is the number of stars in each age bin. We then plotted the smoothed histograms using a 1D Gaussian kernel with a width of 1 kpc for better visualization. The gray histogram in the bottom panel shows the unsmoothed distribution for stars younger than 1 Gyr. We expect the migration distribution of these youngest stars to peak near 0 kpc with a characteristic width of <2 kpc, reflecting their limited movement since birth.
Other Images in This Article
Copyright and Terms & Conditions
© 2026. The Author(s). Published by the American Astronomical Society.