Image Details
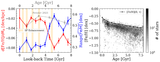
Caption: Figure 1.
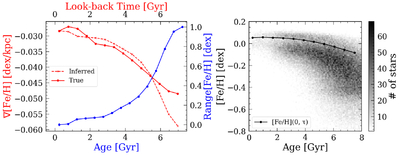
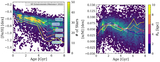
Key plots for inferring the metallicity evolution of the simulated LMC galaxy. Left: the blue line shows the range of metallicity, Range[Fe/H], as a function of age, using a bin width of 0.5 Gyr. The range is measured using the difference between the 95th-percentile and the 10th-percentile of [Fe/H] in mono-age populations to account for more stars in the inner galaxy compared to the outer. The red solid line shows the true metallicity gradient, ∇[Fe/H], as a function of look-back time, measured using the true Rb and [Fe/H] in each mono-age population. The red dashed line is the inferred metallicity gradient using Equation (1). We can reproduce some of the key features, such as the steepening, in the metallicity gradient, and the median absolute deviation from the true metallicity gradient is 6% or 0.002 dex kpc−1. Right: the evolution of metallicity at the galactic center is shown in the black solid line. The background shows the histogram of the age–metallicity relation for this simulated galaxy. Again, the most metal-enriched stars at every age bin should represent the metallicity of the LMC center at that look-back time, assuming a negative metallicity gradient is present at all ages after the disk has started to form.
Other Images in This Article
Copyright and Terms & Conditions
© 2026. The Author(s). Published by the American Astronomical Society.