Image Details
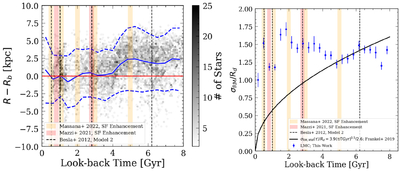
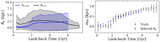
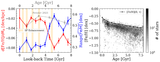
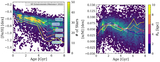
Caption: Figure 8.
Left: R − Rb for the LMC stars, where the blue solid line shows the median and the blue dashed line shows the 1.5∗MAD. The orange and red vertical lines show the SF enhancements taken from P. Massana et al. (2022) and A. Mazzi et al. (2021), respectively. The black dashed lines show the model prediction from G. Besla et al. (2012). Right: radial migration strength as a function of look-back time for the LMC data (blue points). In order to infer the migration strength, we subtracted 1.5 kpc in quadrature from the total scatter to account for the measurement uncertainty in the Rb inference. The inferred migration strength was then scaled by the LMC scale length (1.47 kpc; D. R. Alves 2004). The black line shows the analytic solution of the radial migration strength for the MW, taken from N. Frankel et al. (2019), also scaled with the MW scale length of 2.6 kpc (J. Bland-Hawthorn & O. Gerhard 2016). The LMC stars show an increase in migration strength at ∼5 Gyr compared to the MW could be caused by a higher uncertainty in the observation compared to the simulation (>1.5 kpc) for this age range or a physically larger strength caused by interactions with the SMC and the MW.
Other Images in This Article
Copyright and Terms & Conditions
© 2026. The Author(s). Published by the American Astronomical Society.