Image Details
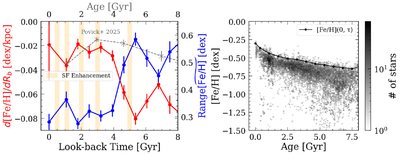
Caption: Figure 5.
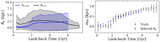
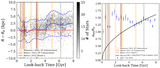
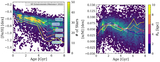
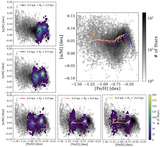
Similar to Figure 1 but with the LMC observational data. The red solid line shows the inferred metallicity gradient as a function of look-back time, derived using the range in metallicity. The orange shaded areas are enhancements in SF at 0.5, 1.1, 2, 3, and 5 Gyr (P. Massana et al. 2022). The gray dashed line shows the metallicity gradient as a function of age taken from J. T. Povick et al. (2025). The observed metallicity gradient as a function of age is shallower than the inferred metallicity gradient at birth due to radial migration. Steepening in the metallicity gradient, defined as where the local minima are, is observed at or close to the times of increased SF around 1 and 5 Gyr. This is also seen in the MW (e.g., Y. L. Lu et al. 2024b) and MW-like simulations (e.g., T. Buck et al. 2023; B. Ratcliffe et al. 2024).
Other Images in This Article
Copyright and Terms & Conditions
© 2026. The Author(s). Published by the American Astronomical Society.