Image Details
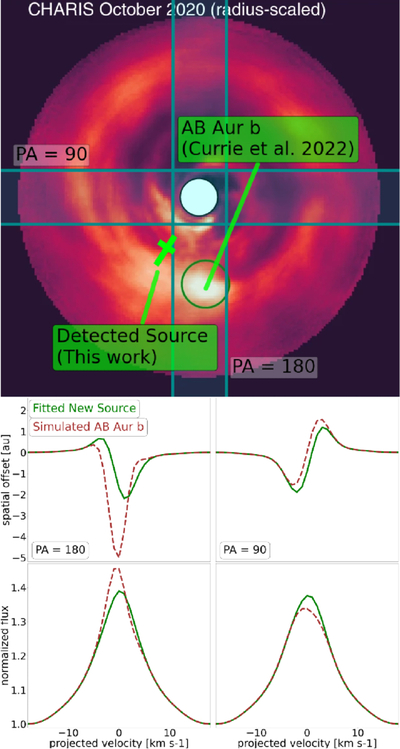
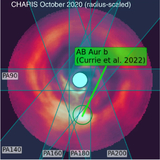
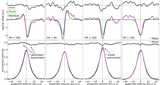
Caption: Figure 11.
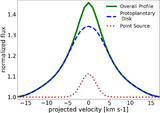
The CHARIS image from T. Currie et al. (2022) with AB Aur b and the detected source pointed out (top). The cross represents the new source’s error. PA180 and PA90 are shown with the corresponding line profiles and spectroastrometric signals of the two sources plotted (bottom). The profiles/signals of the new source are pulled from Figure 7, whereas those AB Aur b are simulated from our model. If detected, AB Aur b would have resulted in a larger offset in PA180. Also, all the line profiles would have developed a low-velocity asymmetry.
Other Images in This Article
Show More
Copyright and Terms & Conditions
© 2026. The Author(s). Published by the American Astronomical Society.
Copyright ©
2026 Astronomy Image Explorer. All Rights Reserved.