Image Details
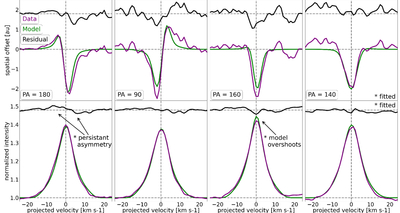
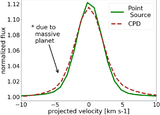
Caption: Figure 7.
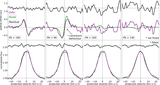
The low-J average transitions (purple) from Figure 4 with the best-fit results (green). The analysis of these line profiles and spectroastrometric signals are described in Sections 3.3.2 and 3.3.2. By assuming the protoplanetary disk has an additional source of emission, the flux and location of said source are constrained (Table 3).
Other Images in This Article
Show More
Copyright and Terms & Conditions
© 2026. The Author(s). Published by the American Astronomical Society.
Copyright ©
2026 Astronomy Image Explorer. All Rights Reserved.