Image Details
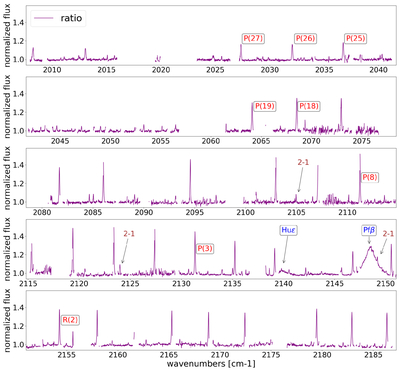
Caption: Figure 2.
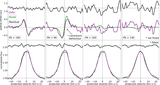
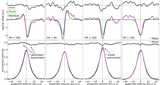
The average spectrum of the observations (Table 1; Section 2). The CO v = 1–0 lines (red) and the hydrogen Pfβ transition (blue) are analyzed in Section 3). A select few CO v = 2–1 lines (brown) are labeled, and their presence indicates a high temperature (Section 3.3.1). Also pointed out is the hydrogen Huϵ transition.
Other Images in This Article
Show More
Copyright and Terms & Conditions
© 2026. The Author(s). Published by the American Astronomical Society.
Copyright ©
2026 Astronomy Image Explorer. All Rights Reserved.