Image Details
Caption: Figure 5.
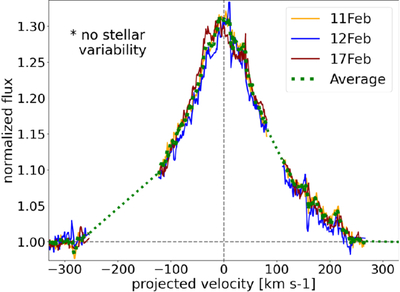
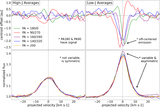
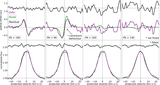
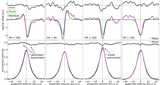
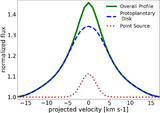
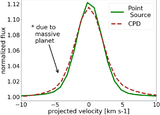
The hydrogen Pfβ transition of each observing epoch (Table 1; Section 3). No stellar variability was detected during the one-week span of observations. The average profile (green) is utilized for determining the velocity spread and calculating a stellar accretion rate in Section 3.2. The dashed lines are where external features, like telluric corruption and CO lines, are present and have been masked over via linear interpolation.
Other Images in This Article
Show More
Copyright and Terms & Conditions
© 2026. The Author(s). Published by the American Astronomical Society.
Copyright ©
2026 Astronomy Image Explorer. All Rights Reserved.