Image Details
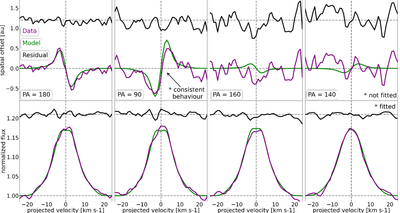
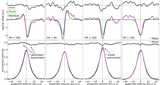
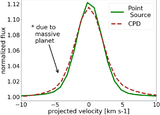
Caption: Figure 6.
The high-J average transitions (purple) from Figure 4 with the best-fit results (green). The analysis of these line profiles (not spectroastrometric signals) are described in Section 3.3.1, where the protoplanetary disk’s radial extant, surface temperatures, and surface densities are constrained (Table 3).
Other Images in This Article
Show More
Copyright and Terms & Conditions
© 2026. The Author(s). Published by the American Astronomical Society.
Copyright ©
2026 Astronomy Image Explorer. All Rights Reserved.