Image Details
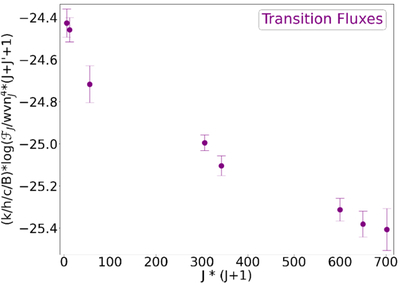
Caption: Figure 3.
Rotational diagram for the transitions labeled in Figure 2. In order, the data points are R(2), P(3), P(8), P(18), P(19), P(25), P(26), and P(27). If the observed fluxes originates from an optically thin, isothermal source, then the data points should follow a line, which they do not (Section 3). This is an indication that the emission from AB Aur’s protoplanetary disk has a gradient in optical depth and temperature.
Other Images in This Article
Show More
Copyright and Terms & Conditions
© 2026. The Author(s). Published by the American Astronomical Society.
Copyright ©
2026 Astronomy Image Explorer. All Rights Reserved.