Image Details
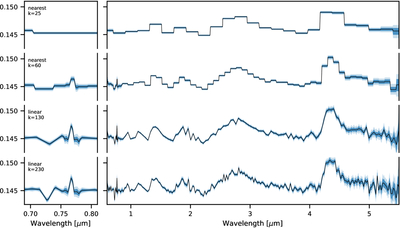
Caption: Figure 9.
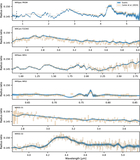
Posterior WASP-39 b transmission spectra estimated from the joint analysis of NIRSpec, NIRSpec PRISM, NIRCam, and NIRISS data using ExoIris. The black line shows the posterior median model, and the blue shading shows the 68% and 95% central posterior intervals. The transmission spectrum was estimated progressively, starting with nearest-neighbor interpolation with a low radius-ratio knot resolution (top), and ending with a linear interpolation with a high knot resolution (bottom).
Other Images in This Article
Copyright and Terms & Conditions
© 2026. The Author(s). Published by the American Astronomical Society.
Copyright ©
2026 Astronomy Image Explorer. All Rights Reserved.