Image Details
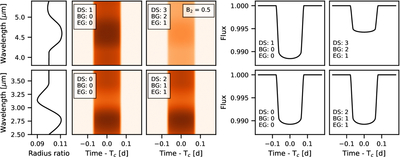
Caption: Figure 3.
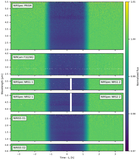
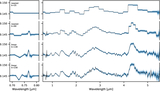
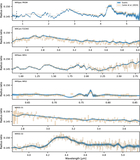
Example illustrating the use of offset groups to account for instrument- or epoch-dependent additive offsets arising from, for example, errors in bias-level estimation or instrumental systematics. The figure shows four spectrophotometric datasets from two transit epochs, each observed with two detectors. The first column shows the radius ratio as a function of wavelength, the next two columns show the spectrophotometric model for all datasets, and the final two columns display the average light curves. The dataset index is denoted by DS, the offset-group index by BG, and the epoch-group index by EG (see Section 2.7). Datasets 0 and 1 were observed at epoch 0 and do not feature an offset between the two detectors. However, datasets 2 and 3, observed at epoch 1, show an offset, with the transit of dataset 3 being, on average, half the transit depth of dataset 1.
Other Images in This Article
Copyright and Terms & Conditions
© 2026. The Author(s). Published by the American Astronomical Society.