Image Details
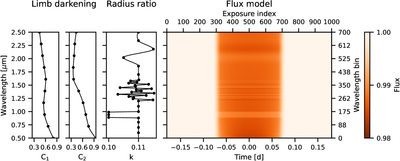
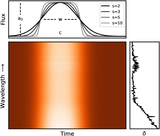
Caption: Figure 1.
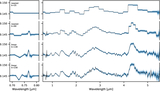
Example of a spectrophotometric transit model. The first two panels show the power-2 limb-darkening coefficients as splines over wavelength with freely placed knots. The third panel shows the planet’s radius ratio modeled in the same way. The rightmost panel displays the model flux as a function of time and wavelength.
Other Images in This Article
Copyright and Terms & Conditions
© 2026. The Author(s). Published by the American Astronomical Society.
Copyright ©
2026 Astronomy Image Explorer. All Rights Reserved.