Image Details
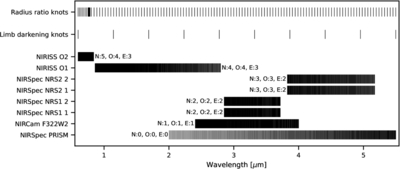
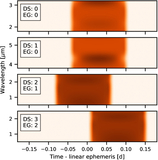
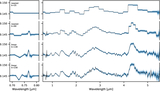
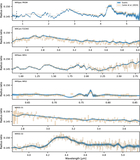
Caption: Figure 7.
ExoIris setup for the WASP-39 b ERS joint analysis. The top row shows the radius-ratio knot locations, the second row shows the limb-darkening knot locations, and the remaining rows show the central wavelengths of the spectroscopic elements for each dataset. The noise (N), offset (O), and epoch (E) group assignments are indicated beside each dataset’s wavelength coverage. Details on cropping and binning are provided in the text.
Other Images in This Article
Copyright and Terms & Conditions
© 2026. The Author(s). Published by the American Astronomical Society.
Copyright ©
2026 Astronomy Image Explorer. All Rights Reserved.