Image Details
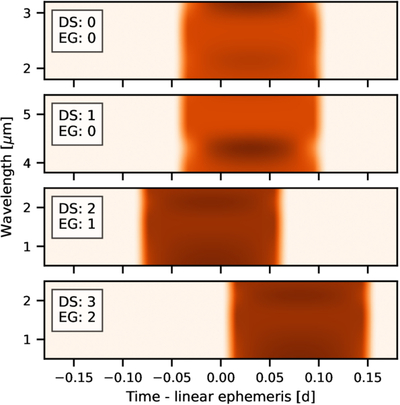
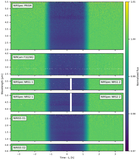
Caption: Figure 4.
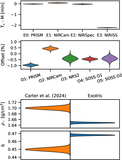
Example illustrating the use of epoch groups (EG) to account for TTVs in a joint transmission spectrum analysis with ExoIris. The example includes four spectrophotometric datasets (DS): two from the same epoch observed with different instruments, and two from separate epochs observed with a third instrument.
Other Images in This Article
Copyright and Terms & Conditions
© 2026. The Author(s). Published by the American Astronomical Society.
Copyright ©
2026 Astronomy Image Explorer. All Rights Reserved.