Image Details
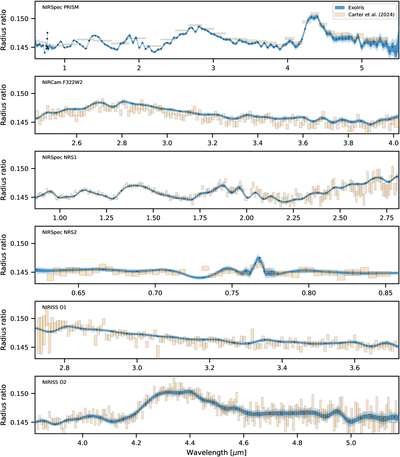
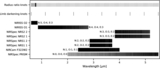
Caption: Figure 10.
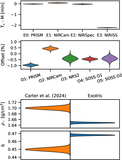
As in Figure 9, but comparing the A. L. Carter et al. (2024) results with the ExoIris analysis using quadratic B-spline interpolation with 130 radius-ratio knots. The black points show the median posterior radius-ratio knot values, and the orange shading shows the 1σ intervals from the A. L. Carter et al. (2024) analysis with fitted limb darkening and bin scale 5.
Other Images in This Article
Copyright and Terms & Conditions
© 2026. The Author(s). Published by the American Astronomical Society.
Copyright ©
2026 Astronomy Image Explorer. All Rights Reserved.