Image Details
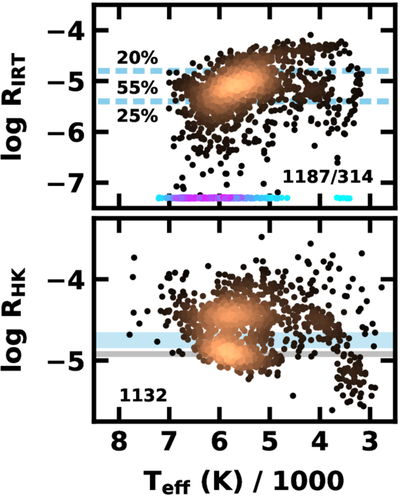
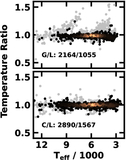
Caption: Figure 14.
Activity indices for Ca II H & K (﹩{R}_{\mathrm{HK}}^{{\prime} }﹩; lower panel, 1132 stars) and the Ca II infrared triplet (﹩{R}_{\mathrm{IRT}}^{{\prime} }﹩; upper panel, 1501 stars including 314 upper limits) as a function of Teff. Lower panel: the thin gray bar (thick blue bar) indicates the range of activity for the Sun (the Vaughan–Preston gap). Upper panel: points with cyan (low density) to pink (high density) colors at the bottom of the plot show the 314 stars with α < 0. Three points with α > 0 have log ﹩{R}_{\mathrm{IRT}}^{{\prime} }﹩ ≈−7.5 to −8.3 and lie below the extent of the plot. Dashed blue lines indicate the boundaries of the high-, moderate-, and low-activity regimes of A. C. Lanzafame et al. (2023); the percentage of stars with α > 0 in each regime appears at the left edge of the plot.
Other Images in This Article
Show More
Copyright and Terms & Conditions
© 2026. The Author(s). Published by the American Astronomical Society.