Image Details
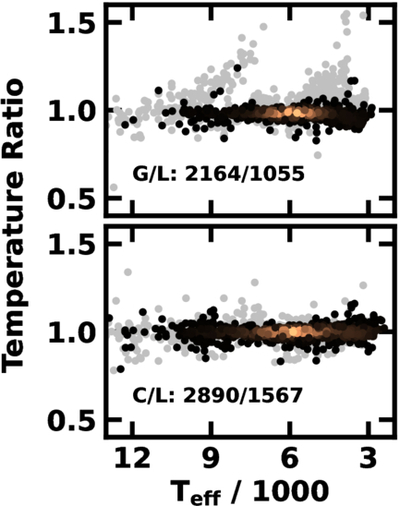
Caption: Figure 7.
Ratio of Teff estimates from Gaia and the literature (upper panel) and from B − V and the literature (lower panel). In each panel, light-gray points plot results for the complete set of common stars. The “copper” sequence of black, gold, and yellow points indicates ratios for stars within 80 pc of the Sun; yellow (black) regions have the highest (lowest) density of points. The numbers in each panel indicate the number of common stars in the full sample and the 80 pc sample. In the upper (lower) panel, the median ratio for all stars is 0.986 (0.998) with an interquartile range of 0.032 (0.027). For the 80 pc sample, the median ratio is 0.983 (upper panel) and 0.999 (lower panel) with an interquartile ranges of 0.018 and 0.021. There is no correlation between the ratios and Teff.
Other Images in This Article
Show More
Copyright and Terms & Conditions
© 2026. The Author(s). Published by the American Astronomical Society.