Image Details
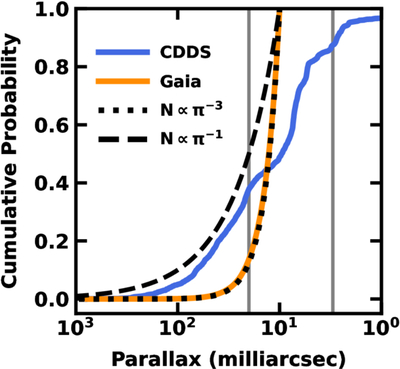
Caption: Figure 3.
Cumulative probability distribution of parallaxes for CDDS stars (blue curve) and stars in the Gaia 100 pc sample (Gaia Collaboration et al. 2021b) that lie close to the M. J. Pecaut & E. E. Mamajek (2013) main sequence (orange curve). The set of CDDS (Gaia) stars follows an n ∝ π0 (n ∝ π−2) volume density distribution, as indicated by the dashed (dotted) black curves.
Other Images in This Article
Show More
Copyright and Terms & Conditions
© 2026. The Author(s). Published by the American Astronomical Society.
Copyright ©
2026 Astronomy Image Explorer. All Rights Reserved.