Image Details
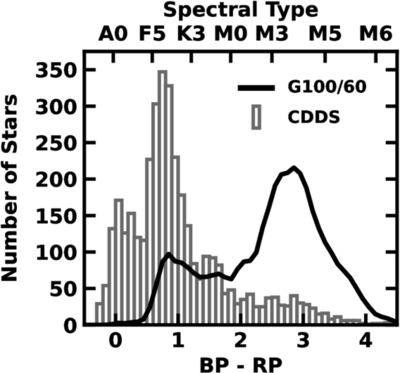
Caption: Figure 4.
Frequency of BP − RP colors (lower x-axis labels) and main-sequence spectral types (upper x-axis labels; M. J. Pecaut & E. E. Mamajek 2013) of stars in the CDDS sample (histogram) and main-sequence stars in the Gaia 100 pc sample (solid line; Gaia Collaboration et al. 2021b). The frequency of Gaia stars has been normalized by a factor of 1/60. Relative to the Gaia sample of MS stars within 100 pc, the CDDS sample has many more AFGK stars and many fewer M-type and later stars.
Other Images in This Article
Show More
Copyright and Terms & Conditions
© 2026. The Author(s). Published by the American Astronomical Society.
Copyright ©
2026 Astronomy Image Explorer. All Rights Reserved.