Image Details
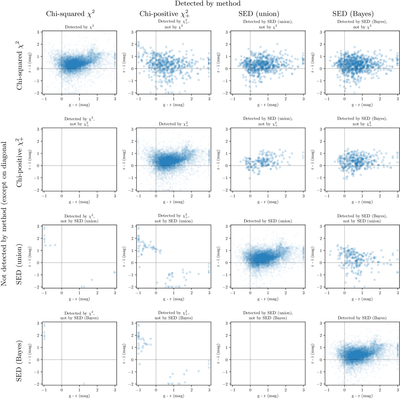
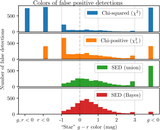
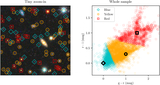
Caption: Figure 14.
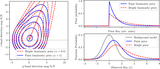
Sources detected by the various methods. On the diagonal are plotted all the sources detected by each method; these are very similar, since the majority of sources detected are in common. On the off-diagonal are shown sources that are detected by one method and not another method. The color–color values plotted are as measured in the single-image detection maps that were used for source detection. In general, the sources detected by only the χ2 and ﹩{\chi }_{+}^{2}﹩ methods have unusual colors, far from the core of the distribution, while the SED-matched methods produce detections that are largely consistent with the bulk of the color–color distribution, since this matches the priors.
Other Images in This Article
Show More
Copyright and Terms & Conditions
© 2026. The Author(s). Published by the American Astronomical Society.