Image Details
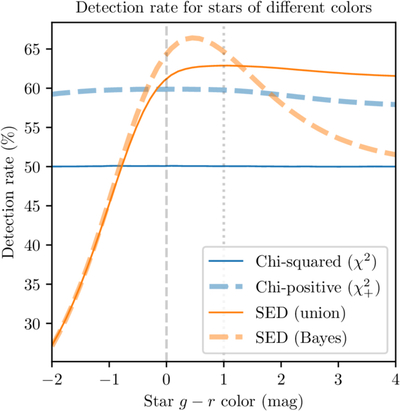
Caption: Figure 7.
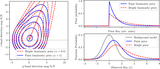
Detection rates for the χ2-based and SED-matched detection methods, as a function of the color of the star. For each color, we set the true fluxes in the g and r bands so that their quadrature-summed signal-to-noise ratio is constant (with the constant chosen so that the χ2 method produced roughly 50% detection rate), and then added independent Gaussian noise with equal variance in the two bands. The threshold for each method was set so that their false-positive rates were equal. Since the χ2 method does not care about the color of the star, its performance is constant. The ﹩{\chi }_{+}^{2}﹩ method has a slight sensitivity to the color of the star: at the color extremes where the flux is concentrated in one band, noise can scatter the star to have negative flux, which makes the ﹩{\chi }_{+}^{2}﹩ method less likely to detect it. But the largest effect is due to the ﹩{\chi }_{+}^{2}﹩ method having a lower detection threshold because ignoring negative fluxes results in a lower false-positive rate, giving it an overall greater detection rate than the χ2 method. As expected, the SED-matched methods show a “tuning” effect where they are most efficient at detecting stars of the expected colors, which in this case are, as before, “flat” (color zero), “red” (color one), and “r-band-only”; for the Bayesian methods these are weighted 49%, 49%, and 2%, respectively. The vertical dashed lines mark these “tuned” colors. As a result, very blue stars are unexpected, and their detection efficiency drops sharply, while very red stars are expected (even if at a low rate) and show a fair detection rate. Interestingly, the Bayesian method peaks at color 0.5, because these stars are acceptable to both the “flat” and “red” SEDs.
Other Images in This Article
Show More
Copyright and Terms & Conditions
© 2026. The Author(s). Published by the American Astronomical Society.