Image Details
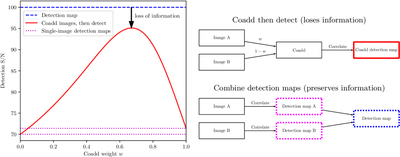
Caption: Figure 1.
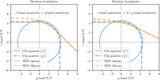
The benefit of constructing a detection map vs. coadding the images and then detecting sources on the coadd. Here we have two images with PSF widths different by a factor of two, and exposure times such that the depths are similar. The signal-to-noise ratio at which a source is detected in the individual images is shown by the dotted lines at the bottom. By constructing a detection map, we extract all the available signal in the combination of the two images; the detection map signal-to-noise ratio (dashed line at top) equals the sum-in-quadrature of the two images. However, if we instead coadd the images and then detect the source in the coadd (solid curve), we lose a significant fraction of the signal-to-noise ratio, regardless of the weighting factor applied to the two images. That is, the solid line never reaches the dashed line; creating a coadd and then detecting on it always loses signal-to-noise ratio when the PSFs are not identical.
Other Images in This Article
Show More
Copyright and Terms & Conditions
© 2026. The Author(s). Published by the American Astronomical Society.