Image Details
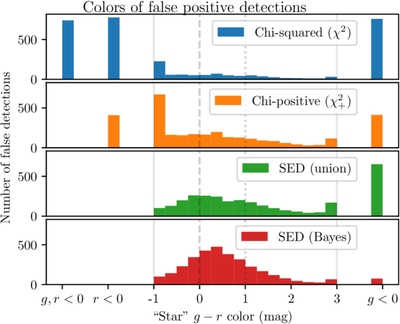
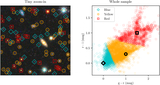
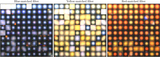
Caption: Figure 8.
The colors of false-positive detections for each method. We generated 100 million samples of Gaussian noise with equal variance for the g and r fluxes. The thresholds for each method were set to produce approximately equal numbers of false positives. Detections in the quadrants with negative fluxes are shown in separate bins, and “stars” with extreme flux ratios are clipped to the color range shown, −1 to +3. The χ2 method generates false positives in all quadrants equally. The ﹩{\chi }_{+}^{2}﹩ method does not generate any both-negative false positives and generates fewer false positives with one negative flux. The SED-matched methods do not generate any false positives with negative r flux and generally produce false positives in accordance with the SEDs they expect to find.
Other Images in This Article
Show More
Copyright and Terms & Conditions
© 2026. The Author(s). Published by the American Astronomical Society.