Image Details
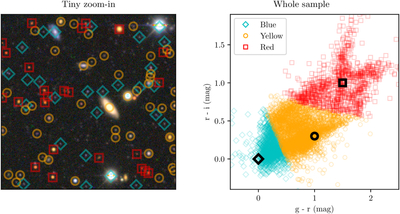
Caption: Figure 9.
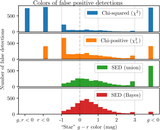
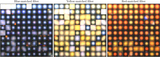
Left: a 600 × 600 pixel zoom-in of a tiny fraction of the DECam data used in this experiment, coadded and shown with a red, green, and blue color scheme and arcsinh stretch. Detected sources are marked with symbols indicating which of the SED-matched filters yields the strongest detection; for clarity here we are using an extremely high detection threshold of 30σ. Right: the positions in color space of detected sources, classified by the SED-matched filter that yields the strongest detection. The thick circles mark the color to which each filter is tuned. Each SED-matched filter most strongly detects sources nearby in color spaces, where the exact dividing line depends on the signal-to-noise ratio in the different filters.
Other Images in This Article
Show More
Copyright and Terms & Conditions
© 2026. The Author(s). Published by the American Astronomical Society.