Image Details
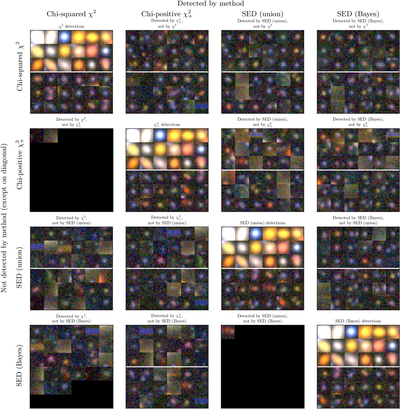
Caption: Figure 13.
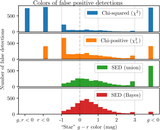
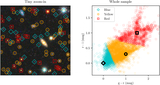
Sources detected by the different methods. On the diagonal are shown grids of sources detected by each method, including the first (brightest) and last (faintest) 18 sources. Notice that the brightest sources detected by the different methods are almost identical. The off-diagonal images show the brightest and faintest sources that are detected by one method and not another. Two methods can be compared qualitatively by examining the two plots that appear across the diagonal from each other. For the images below the diagonal, a significant number of the additional detections are not true isolated sources but perhaps arise from small deviations in the outer light profiles of galaxies. Note: although the detection was performed on single images, the color images here are from 100-image deep coadds, in order to show the “truth.” In general, the SED-matched methods produce more real source detections than the chi-squared methods.
Other Images in This Article
Show More
Copyright and Terms & Conditions
© 2026. The Author(s). Published by the American Astronomical Society.