Image Details
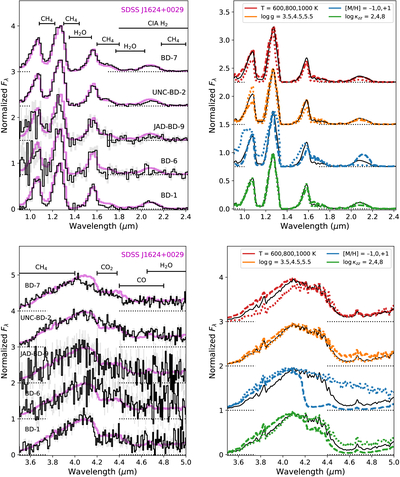
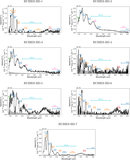
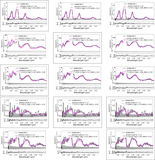
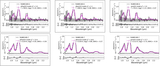
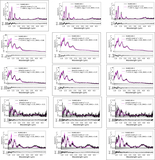
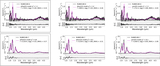
Caption: Figure 7.
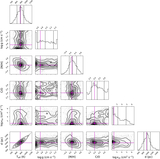
Spectral variations among distant mid- and late-T dwarfs identified by JWST. Left panels: comparison of NIRSpec prism spectra of (from top to bottom): RUBIES-BD-7, UNCOVER-BD-2 (“UNC-BD-2;” data from A. J. Burgasser et al. 2024), JADES-GS-BD-9 (“JAD-BD-9;” data from K. N. Hainline et al. 2024b), RUBIES-BD-6, and RUBIES-BD-1 (solid black lines). These spectra are compared to equivalent data for the T6 spectral standard SDSS J1624+0029 (repeated magenta line, data from S. A. Beiler et al. 2024a) in the 0.9–2.4 μm (top) and 3.5–5.0 μm (bottom) ranges. All spectra are normalized at the 1.25 and 4 μm peaks, and offset for clarity (dotted lines). Right panels: comparison of parameter variations in Elf Owl atmosphere models for T dwarf spectra in the same wavelength ranges. The black line is a reference spectrum with Teff = 800 K, ﹩\mathrm{log}{\rm{g}}﹩ = 4.5, [M/H] = 0, and ﹩\mathrm{log}{\kappa }_{{\rm{zz}}}﹩ = 4. The colored dashed and dotted lines show the changes in spectral morphologies for ΔTeff = ±200 K (red lines), Δ﹩\mathrm{log}{\rm{g}}﹩ = ±0.5 dex (orange lines), Δ[M/H] = ±0.5 dex (blue lines), and ﹩\mathrm{log}{\kappa }_{{\rm{zz}}}﹩ = 2 and 8 (green lines). Model spectra are normalized and offset in the same manner as the observed spectra.
Other Images in This Article
Copyright and Terms & Conditions
© 2026. The Author(s). Published by the American Astronomical Society.