Image Details
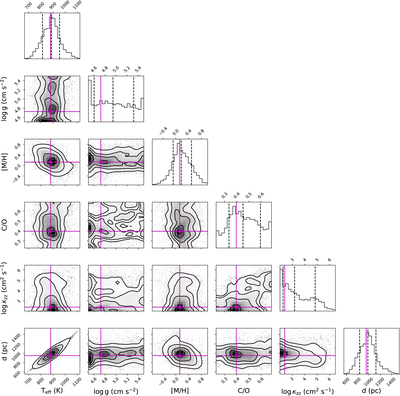
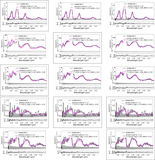
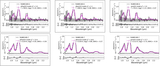
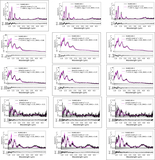
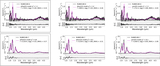
Caption: Figure 6.
Example corner plot of Elf Owl fits to NIRSpec/prism data for RUBIES-BD-1. Diagonal panels display the marginalized posterior distributions for Teff, ﹩\mathrm{log}{\rm{g}}﹩, [M/H], C/O, ﹩\mathrm{log}{\kappa }_{{\rm{zz}}}﹩, and distance, while the inner panels display contour plots of distributions marginalized over parameter pairs to illustrate correlations. Contour shading indicates likelihood values, and lines trace 25%, 50%, and 75% likelihood thresholds. Magenta lines indicate the parameter values for the best-fitting individual model, while the vertical dashed lines in the marginalized distributions indicate the 16%, 50%, and 84% quantiles.
Other Images in This Article
Copyright and Terms & Conditions
© 2026. The Author(s). Published by the American Astronomical Society.