Image Details
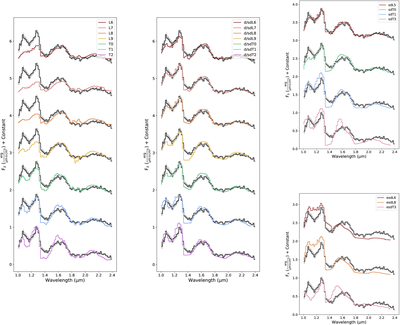
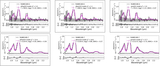
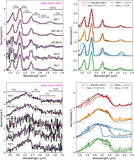
Caption: Figure 3.
Comparison of the 0.9–2.5 μm NIRSpec/prism spectrum of RUBIES-BD-3 (black line) to L6 to T2 dwarf standards (left panel); d/sdL6 to d/sdT2 mild subdwarf standards (center panel); sdL5, sdT0, sdT1, and sdT3 subdwarf standards (top right panel); and esdL6, esdL8, and esdT3 extreme subdwarf standards (bottom right panel). Standards are color coded by spectral type. All spectra are normalized and offset by constants to facilitate comparison.
Other Images in This Article
Copyright and Terms & Conditions
© 2026. The Author(s). Published by the American Astronomical Society.
Copyright ©
2026 Astronomy Image Explorer. All Rights Reserved.