Image Details
Caption: Figure 1.
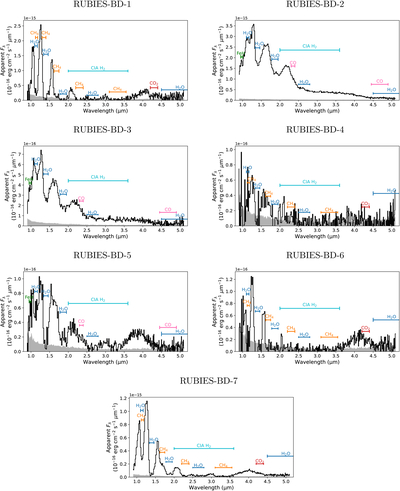
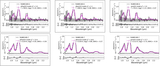
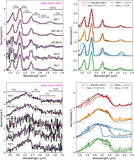
NIRSpec/prism spectra of the seven RUBIES brown dwarfs identified in this study (black lines). Spectra are shown in apparent Fλ flux densities after scaling to their F444W magnitudes, and uncertainties are indicated in gray. Key spectral features present in the 1–5 μm spectra of L and T dwarfs are labeled.
(The data used to create this figure are available in the online article.)
(The data used to create this figure are available.)
Other Images in This Article
Copyright and Terms & Conditions
© 2026. The Author(s). Published by the American Astronomical Society.
Copyright ©
2026 Astronomy Image Explorer. All Rights Reserved.