Image Details
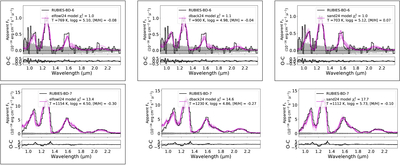
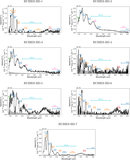
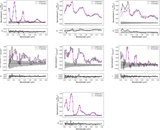
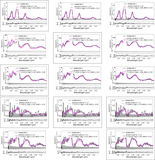
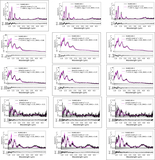
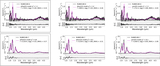
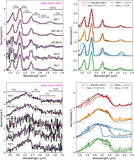
Caption: Figure 4.
MCMC fits to NIRSpec/prism data constrained to the NIR (0.9–2.4 μm) range. Each row corresponds to one of the RUBIES brown dwarf spectra scaled to the apparent F444W magnitude (black lines), while the columns separate fits to the Elf Owl (left), Diamondback (middle) ,and SAND (right) models. Both the best-fit models (solid magenta lines) and draws from the posterior distribution (semitransparent magenta lines) are shown, and the ±1σ spectral uncertainties are indicated by the gray band. Below each spectral comparison, we compare the difference between the source and best-fit model fluxes (O – C as black lines) to the ±1σ spectral uncertainties (gray bands). Panels that are surrounded by boxes indicate models that provide the best fits, including equivalent cases (see Table 6).
Other Images in This Article
Copyright and Terms & Conditions
© 2026. The Author(s). Published by the American Astronomical Society.