Image Details
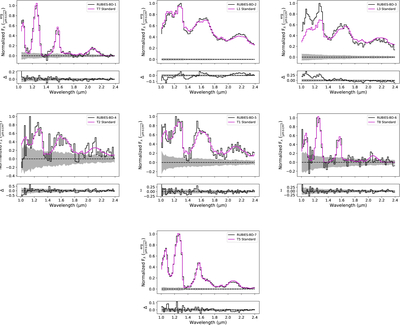
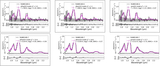
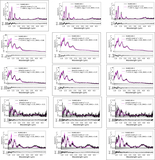
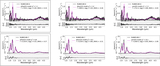
Caption: Figure 2.
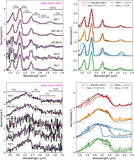
RUBIES brown dwarf spectra in the 0.9–2.5 μm range (black lines with uncertainties as gray shading) compared to best-fit dwarf spectral standards (magenta lines). RUBIES spectra are normalized to the 1.2–1.3 μm peak, and standards are scaled to minimize χ2 (Equation (2)). The bottom panels of each plot show the difference between source and standard spectra (Δ) in black, compared to the uncertainty shaded in gray.
Other Images in This Article
Copyright and Terms & Conditions
© 2026. The Author(s). Published by the American Astronomical Society.
Copyright ©
2026 Astronomy Image Explorer. All Rights Reserved.