Image Details
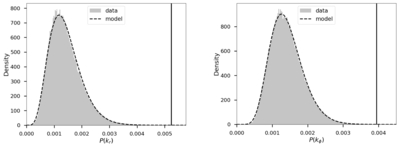
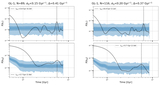
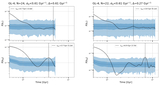
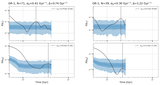
Caption: Figure 6.
Histograms of the r (left) and ϕ (right) direction power spectra in the high wavenumber region. The dashed lines represent the fitted models of the two-parameter gamma distribution. The vertical solid lines mark the maximum peak of the median power spectra of substructure GL-1.
Other Images in This Article
Copyright and Terms & Conditions
© 2026. The Author(s). Published by the American Astronomical Society.
Copyright ©
2026 Astronomy Image Explorer. All Rights Reserved.