Image Details
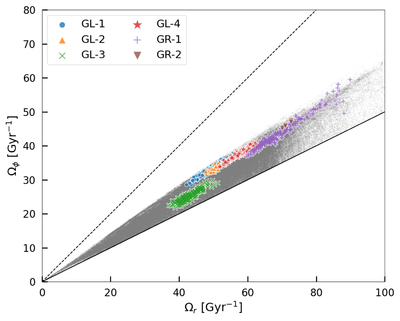
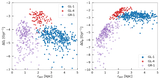
Caption: Figure 2.
Distributions of halo stars (gray dots) and substructure member stars (colored points) in the orbital frequency space, with colors and markers indicating the different substructures. The dashed and solid lines represent the two limiting cases of a point mass (Ωϕ = Ωr) and a homogeneous sphere (Ωϕ = Ωr/2), respectively.
Other Images in This Article
Copyright and Terms & Conditions
© 2026. The Author(s). Published by the American Astronomical Society.
Copyright ©
2026 Astronomy Image Explorer. All Rights Reserved.