Image Details
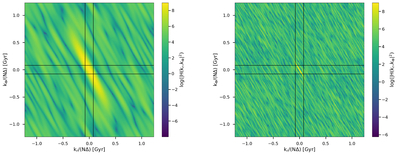
Caption: Figure 4.
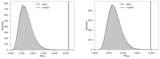
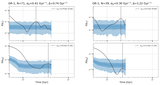
Power spectra of the Fourier transform for substructure GL-1 (left panel) and a random sample (right panel). The axes represent the wavenumbers in the two direction. The black lines mark the regions used to compute the 1D power spectra.
Other Images in This Article
Copyright and Terms & Conditions
© 2026. The Author(s). Published by the American Astronomical Society.
Copyright ©
2026 Astronomy Image Explorer. All Rights Reserved.