Image Details
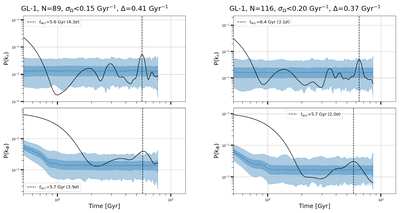
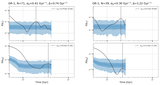
Caption: Figure 5.
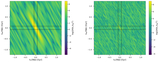
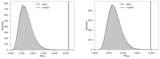
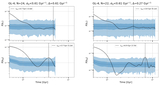
Median 1D power spectra for substructure GL-1 (black solid curves) and random samples (blue dashed curves). The 1σ and 3σ intervals of the random samples are shown as dark blue and light blue shaded regions, respectively. The x-axes represent 2π times the wavenumbers in the r (top panels) and ϕ (bottom panels) directions. The estimated accretion times are marked by black vertical dashed lines, with significances given in the legend. Left and right panels show the results using the A.-C. Eilers et al. (2019) and J. Bovy (2015) potentials, respectively. Subtitles indicate the substructure name, number of stars, bin width Δ, and applied uncertainty selection.
Other Images in This Article
Copyright and Terms & Conditions
© 2026. The Author(s). Published by the American Astronomical Society.